


Welcome to Student Outcomes: Connect the Dots With Usage Data. This post is the first in a three-part series designed to support education leaders in making better decisions about digital resources. The series will focus on using data to ensure equitable digital learning access and using research to increase the instructional impact of digital resources. Here’s where you can read part two and part three of this series.
Over the past year and a half, schools and districts made large investments in digital technologies, including devices, internet, and learning applications. As schools leverage these resources as part of their instructional strategies, they face questions about evaluating and selecting learning applications for their schools and students.
For example, if your district identifies the need for a new math app to support learning in the early grades or wants evidence that the current instructional apps in use are research-based, where would you look for studies that verify which apps show evidence of effectiveness? If your district wants to analyze the differences in access to high-quality digital resources, what data should you consult? Once you’ve identified some validating research, what should you look out for, and how do you know if the findings will translate in your context? Further, what research exists on the product’s efficacy with diverse student groups, and how significant was the impact?
Before we dive into the research on application efficacy, we want to share what our data reveals about the usage and quality of digital resources in schools. In part one of this series, we examine a case study that compares the usage and quality of top math apps between high-and-low poverty schools in ClassLink districts.
The New Digital Divides: Usage and Quality of Instructional Application
We conducted analyses of digital usage across two states where the majority of districts use ClassLink. We wanted to understand the use of digital resources in these districts, which all provided high access to devices and the internet for their students. Here’s what we found.
- Across schools and districts, a large percentage of students show up in digital environments.
- Variability exists in what students do in digital environments.
When we dug deeper to analyze trends in the use of mathematics learning applications, we discovered:
- Dozens of math applications in use across the districts
- Variability in math applications both within districts and across schools in districts
- Students in high-poverty schools are more likely to lack access to a dedicated math application
- When students in high-poverty schools receive access to a math learning application it is more likely to focus on rote practice and memorization and less likely to provide robust feedback and diverse student representation
- In low-poverty schools, the top math applications students have access to are more likely to focus on conceptual knowledge than drill and kill tasks
- The type of math application used in a school was also frequently related to the level of student usage
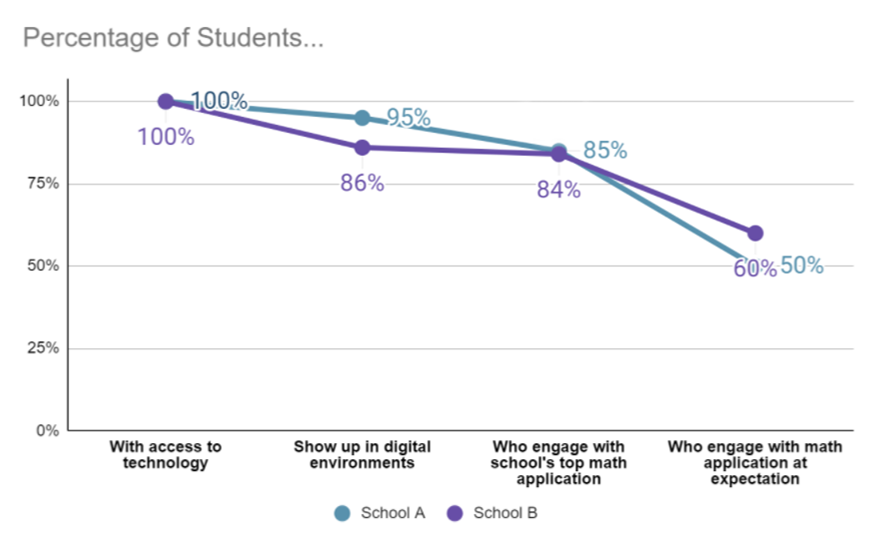
In the below example, we display digital engagement in two schools from one district. We present two schools, one with a high concentration of poverty and another with a low concentration of poverty. Each school uses a different math application. The math application in the high-poverty school focuses on rote memorization, while the one in the low-poverty school prioritizes conceptual understanding. As illustrated below, the low-poverty school (School A) had six times as many students who engage with the school’s most used math application as the high-poverty school (School B).

District Spotlights: Hamilton and Pickens County
Not every district showed this pattern, however. Two ClassLink districts, in particular, stood out as exemplars when looking at their usage data.
In Tennessee, two schools in Hamilton County School District, one high-poverty and one low-poverty had over 80 percent engagement with their math application. Also, at least half of the students in both schools engaged with the apps at the vendor’s recommended usage.
In Pickens County School District, South Carolina, comparing a high-and low-poverty school, the difference in usage was less than 10 percent.
What Can Districts Do to Address Divides in Digital Resources?
Hamilton and Pickens were both intentional with how they selected a math application.
Hamilton county defined high-quality learning tools and reduced the variability between classes by providing strong guidance for digital resource decision-making. Dr. Nakia Towns, Interim Superintendent of Hamilton County Schools remarked, “We went and found tools that have evidence of impact, [and] that align with the tiers of impact that the federal government has for us. We wanted to go beyond ‘promising’ practices, to see that there has been evidence that children have been experiencing learning with these tools.”
Keys to Pickens’ success include collaboration with the local community and state to ensure access to the internet, a rubric used to evaluate all digital resources, and strong vetting of the research base for digital resources.
To follow in the footsteps of these successful districts, parts two and three of this blog will help districts find and navigate studies and then determine their relevance for your district.
How Can ClassLink Help?
In the host of learning tools used by Hamilton, they label ClassLink as “the key”, to enabling students and teachers to spend more time focused on learning.
ClassLink Analytics provides districts like Hamilton and Pickens with essential information on edtech usage, from the district down to the student level. The findings may lead a district to consider implementing changes including additional professional development, modifying the number of licenses, or purchasing another supplemental app to continue improving the quality of instruction for students.
Arrange a demo today to learn more about how ClassLink Analytics can help your district.
Check back soon for part two of this series, where we’ll focus on how to find relevant studies quickly. Then, in part three, we’ll offer insight on interpreting the significance of studies and judging their applicability for your district.