

Welcome to Planning for Sustainability. This post is the third in a four-part series designed to help education leaders gather and use data to create optimal—and sustainable—digital learning environments. Here’s where you can read part one and part two of this series.
Before relief funding ends in 2024, you’ll need to evaluate your digital resources (new and old) and determine which titles to keep and which need to be sunset. What was once a popular paid subscription in your district may hardly be used now. You may have been implementing two learning management systems and now need to make the decision to cut to one. ClassLink Analytics can help inform those decisions with reports that demonstrate the impact of your digital resources.
This week, let’s look at the helpful data points these reports provide to inform your sustainability plan.
Best Practice
First and foremost, this effort should be a collaboration between your curriculum department and your technology department.
Digital resources that are considered core components of learning infrastructure in your district need to be used with fidelity, such as a learning management system, your student information system, and key curricular resources. Gathering long-term data on those critical systems over time will help you understand when logins take place, how many logins happen, and whether the fidelity of your essential curricular resources is being maintained.
Now let’s explore the reports.
See the Big Picture and the Details
ClassLink Analytics provides reports that give you insight into digital resource use. By using the reports, curricular and edtech leaders can gain visibility into the trends of app use in their entire school district, broken down into school-by-school heatmaps. Each school can then be dissected to see who the individual users are, when they access the resource, and how long they stay on it.

As digital resources are purchased and supported in the classroom through the curricular process, the data shown in ClassLink Analytics will reflect what is taking place in the classroom.
Fidelity Checks
School leaders can also see if resources are being used with fidelity or if a curricular resource is not being used to the proper extent, and classroom teachers may need support. This data can also alert school and district leaders about which resources are being used that perhaps shouldn’t be used.
Keep or Cut? Data Has the Answer
By gathering and documenting usage data now, you’ll be prepared to make data-informed decisions later. When funding for digital resources begins to wane, you’ll have precise data to help you decide which resources need to stay and which ones need to be cut or discontinued because of low usage.
The data collected over time helps establish a baseline for learning so that when resources need to be removed, the impact can be monitored. If cutting the resources creates a detriment to learning, reduced engagement, or other impacts, schools can consider if the resources need to be reinstated.
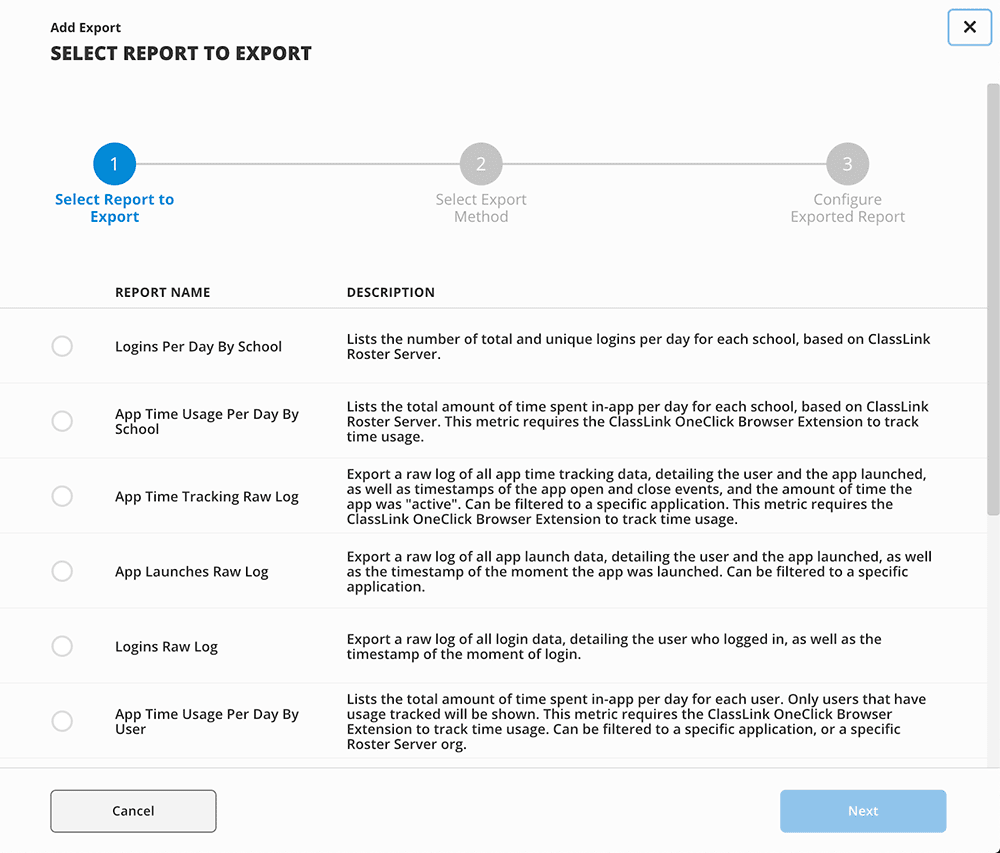
As you plan for sustainable digital learning, all of the following reports are available through ClassLink Analytics and can be helpful for a data deep dive:
- Logins Per Day By School: See the number of total and unique logins per day for each school.
- App Time Usage Per Day By School: See the total amount of time spent in-app per day for each school.
- App Time Usage Per Day By User: See the total amount of time spent in-app per day for each user. You can filter these results for a specific application or a specific Roster Server Org.
- App Time Tracking Raw Log: Export a raw log of all app time tracking data, detailing the user and the app launchpad. You can also see timestamps of the app open and close events, and the amount of time the app was “active”. You can filter these results for a specific application.
- App Launches Raw Log: Export a raw log of all app launch data, detailing the user and the app launched as well as the timestamp of the moment the app was launched. You can filter these results for a specific application.
- Logins Raw Log: Export a raw log of all login data, detailing the user who logged in, as well as the timestamp of the moment of log in.
Support Your Why With Data
Creating a data-informed strategy to monitor your digital resource investments will be a solid approach that you can build now and use in the future to help support the why of why you need to continue investing in resources even after the additional funding has been exhausted.
Coming Up
Stay tuned for the final post in this series where Diane shares how districts can plan for sustainable digital learning even in the face of future rounds of virtual learning. Follow us on social media to stay up to date with new entries in this series, or subscribe using the form below.
Additional Resources
- A Single Sign-On Platform Revolutionized How This District Uses Tech—and Saved $120,000
- Do You Know Your District’s True Digital Story? This Tool Can Help
- ClassLink Analytics
- ClassLink Analytics+
- Already a ClassLink customer? Learn more in our ClassLink Academy micro-course, Analytics: Deep Dive into Data.