


In the last six months, screen time discussions and questions have spiked to an all-time high, leading to legislation, district policies, and daily limits popping up across the country like dandelions.
Guidelines are good. We all want the time students spend on screens to be beneficial and healthy. But what does healthy screen time even look like? And how on earth do we keep a close (and detailed) pulse on not only the minutes students spend on screens, but the quality of that time?
Before you stop reading, I'm not about to suggest you comb through the minute reports you get from apps, programs, and vendors and cram it all together into a franken-report on screen time. Nobody has time for that, and honestly, it wouldn't even give you the full picture.
Instead, I want to do two things. First, show you what screen time actually looks like across real districts right now, because it's not as off-the-rails as you might think.
Second, show you how you can take a legitimate temperature check on how screen time is going for your whole district, your schools, your classes, and even individual students. So you can make changes when you need to and know (with evidence) that you are doing the very best for your students.
What Does Actual Screen Time Data for 5.5 Million Students Look Like?
Here's the data. And if your district uses ClassLink, some of this data is literally yours, combined with data from about 1100 other ClassLink districts across the country.
A note on the numbers: This data reflects digital resources accessed on any device via ClassLink SSO, or any resource that is accessed via a school-or district-owned device, both in school and at home.
- Total screen time per student, per day (at school + at home): 41 minutes
- Time spent in learning applications: 33 minutes (That's 81 percent of their total screen time)
- Learning sessions without digital distractions: 78 percent
- Screen time is lowest in grades K-2 (See graph #2 )
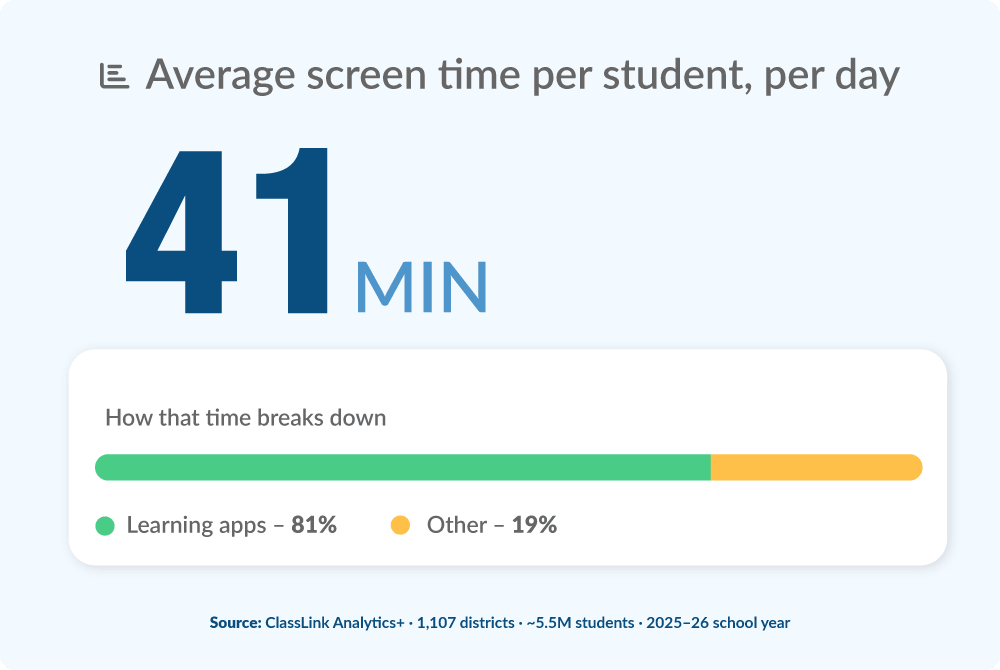

A few things jump out:
- 41 minutes total isn't the runaway screen time number you've been bracing for. That's less time than most kids spend on a single sitcom episode, spread across an entire school day and evening combined.
- 81% of that time is spent learning, not wandering. For every 5 minutes on a device, roughly 4 are going toward actual instruction, not games, social media, or aimless browsing.
- 8 out of 10 learning sessions run from start to finish with no digital distractions. That's a strong sign that when students are supposed to be learning, they mostly are.
None of this means screen time doesn't deserve attention. It means the national conversation and the district-level reality don't always match. And simply counting the minutes isn't enough to truly understand screen time in your environment.
So What Does This Mean for Your District?
Two things, and they pull in slightly different directions.
The first is reassurance: if your gut sense is that most students, most of the time, are using their devices the way you intended, the data across a large and diverse sample of districts backs that up. That's a genuinely useful thing to be able to say in a board meeting, a parent meeting, or a policy conversation.
The second is a nudge: averages hide outliers. A district-wide number of 41 minutes and 81% learning time doesn't tell you which third-grade class in one building is spending 3 hours a day on devices, or which handful of students have distraction rates way above the norm. Those are the students and classrooms that need you to have data that goes beyond minutes, to explore how healthy those minutes are, so you can catch a problem before it becomes a pattern.
Averages alone can't help you there.
That's the gap between "we have a screen time policy" and "we actually know how screen time is going."
How To Close the Gap Between Minutes and Meaning
This is exactly the temperature check we built Screen Time, part of ClassLink Analytics+, to give you. Since it runs on the SSO and device data ClassLink already has, there's nothing new to deploy and nothing new for students to log into. You get one dashboard that tells you:
- Is device time spent learning?
- Are session lengths balanced?
- Is usage within expected hours?
- Are students staying on task?
So instead of guessing whether that policy you rolled out last fall is actually working, you can see it. Instead of waiting for a parent complaint or a teacher flag to know a student's screen habits have shifted, you can catch it early and have real numbers to back up whatever conversation comes next.
Your schools can continue to take advantage of the benefits of technology while ensuring the time students spend on devices is focused, balanced, within expected hours, and spent on the tools you've chosen.
Ask Us the Screen Time Questions You've Been Sitting On
If you're already fielding screen time questions from your board, your superintendent, or worried parents, you don't have to answer them with vague minute counts. We've built the tool to show you the meaning behind those minutes.
See what your district's screen time data actually says with no extra lift for your team. Talk to us about ClassLink Analytics+ and Screen Time.